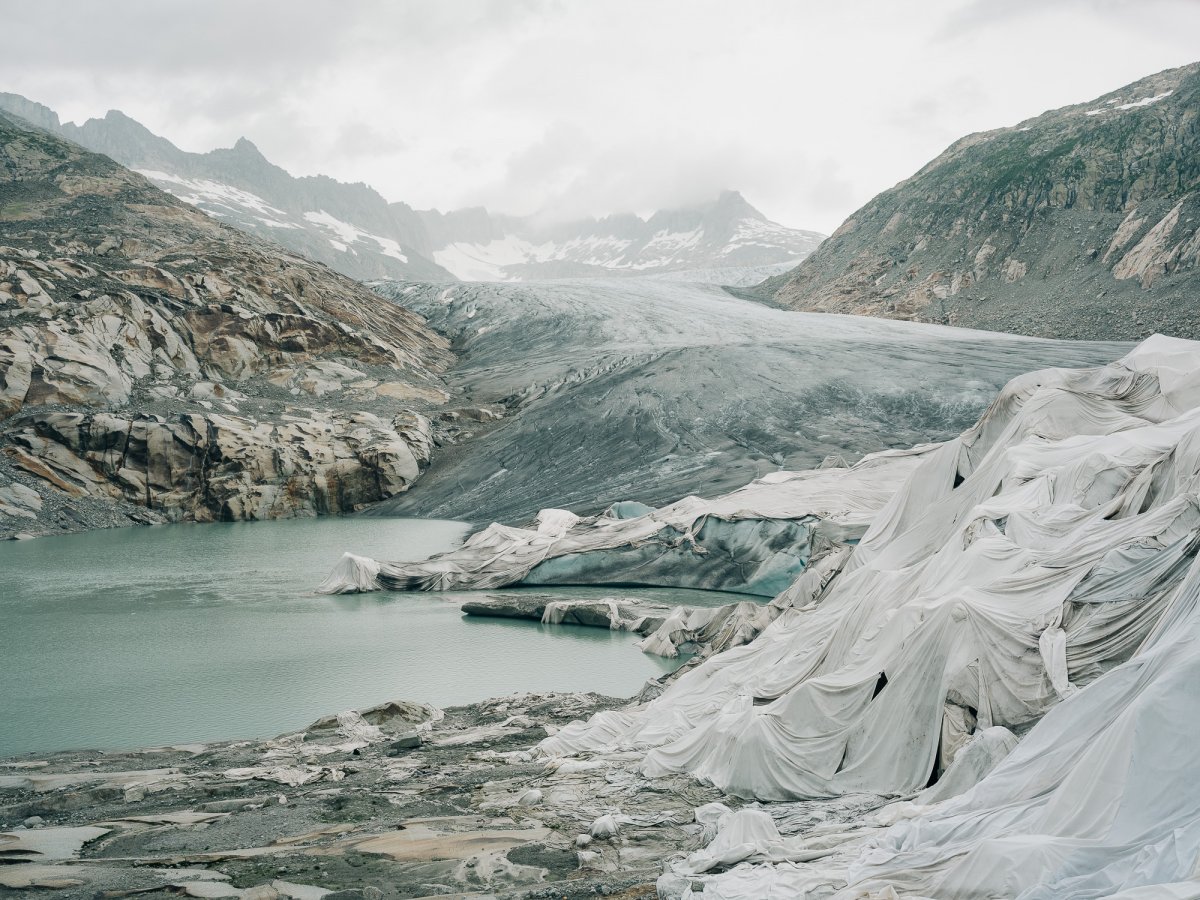
The Rhone glacier in the Swiss Alps in August 2021.
White cloth can slow down the melting of the covered areas. In this case the blanket covers the ice grotto, a tourist attraction. Once a labyrinth under the ice the ceiling is mostly open nowadays.
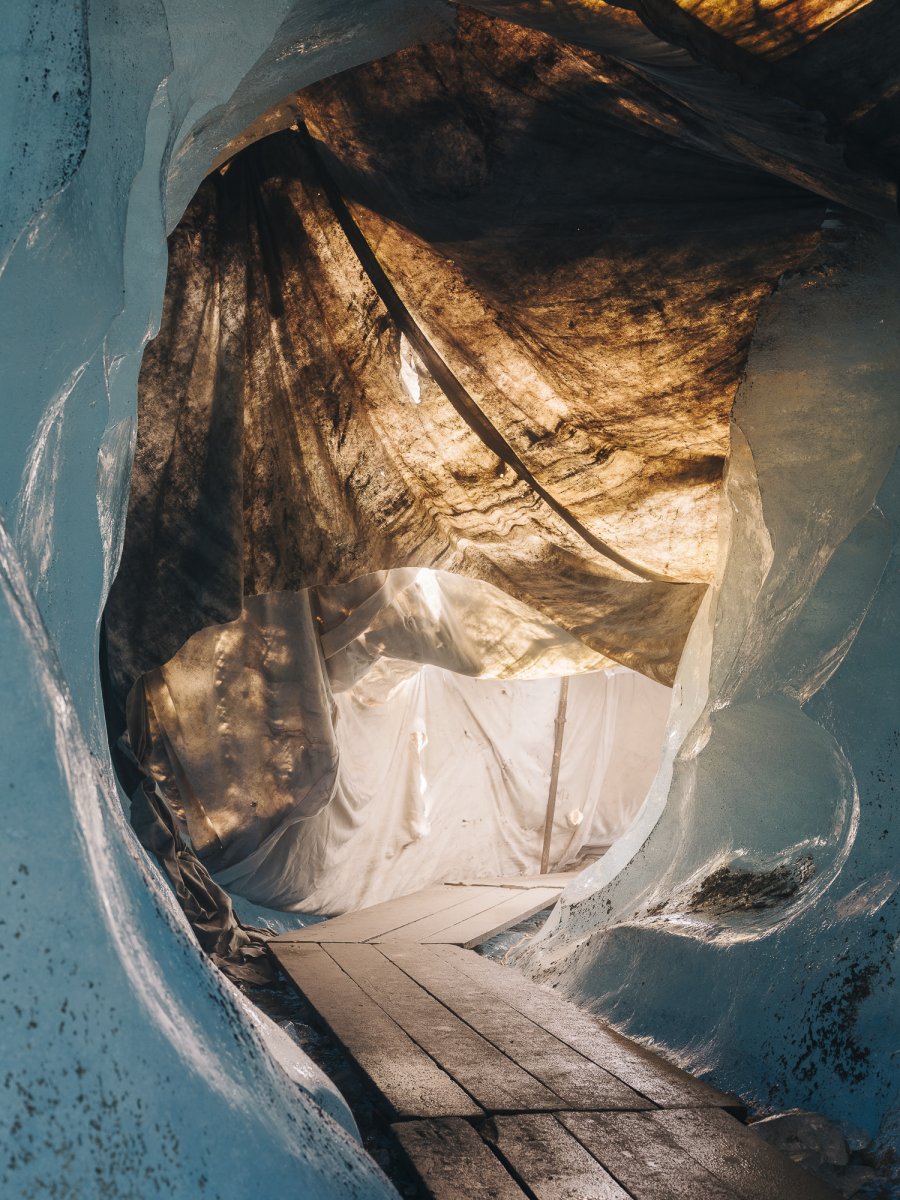
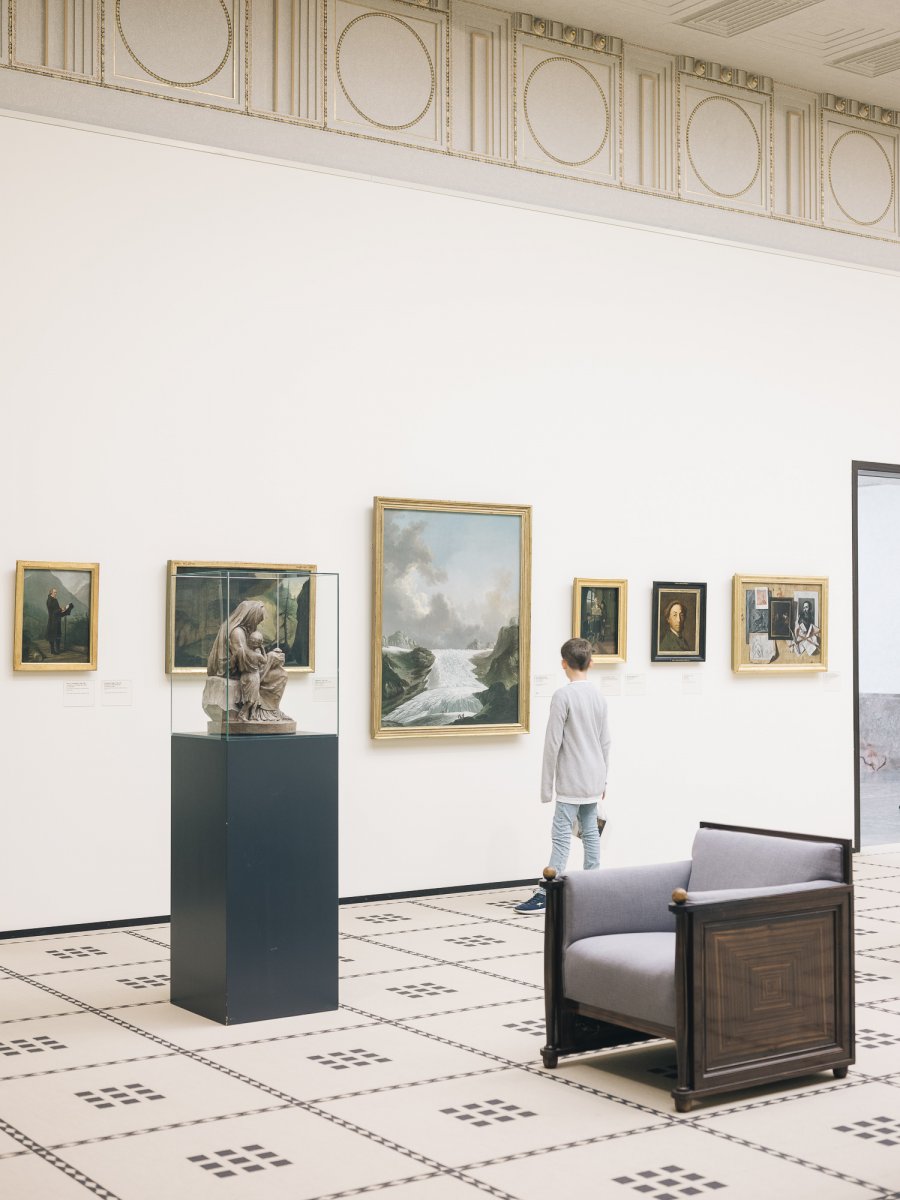
Left: The Rhône Glacier Cave is designed to give visitors an insight into the inner workings of the glacier. The cave was once completely covered in ice, but now it has melted so much that in places it is only covered by the tarpaulins that were supposed to protect it. Right: Painting by Johann Heinrich Wüest in the Kunsthaus in Zurich. The painting from 1772 shows the Rhône glacier when it still reached down into the valley.
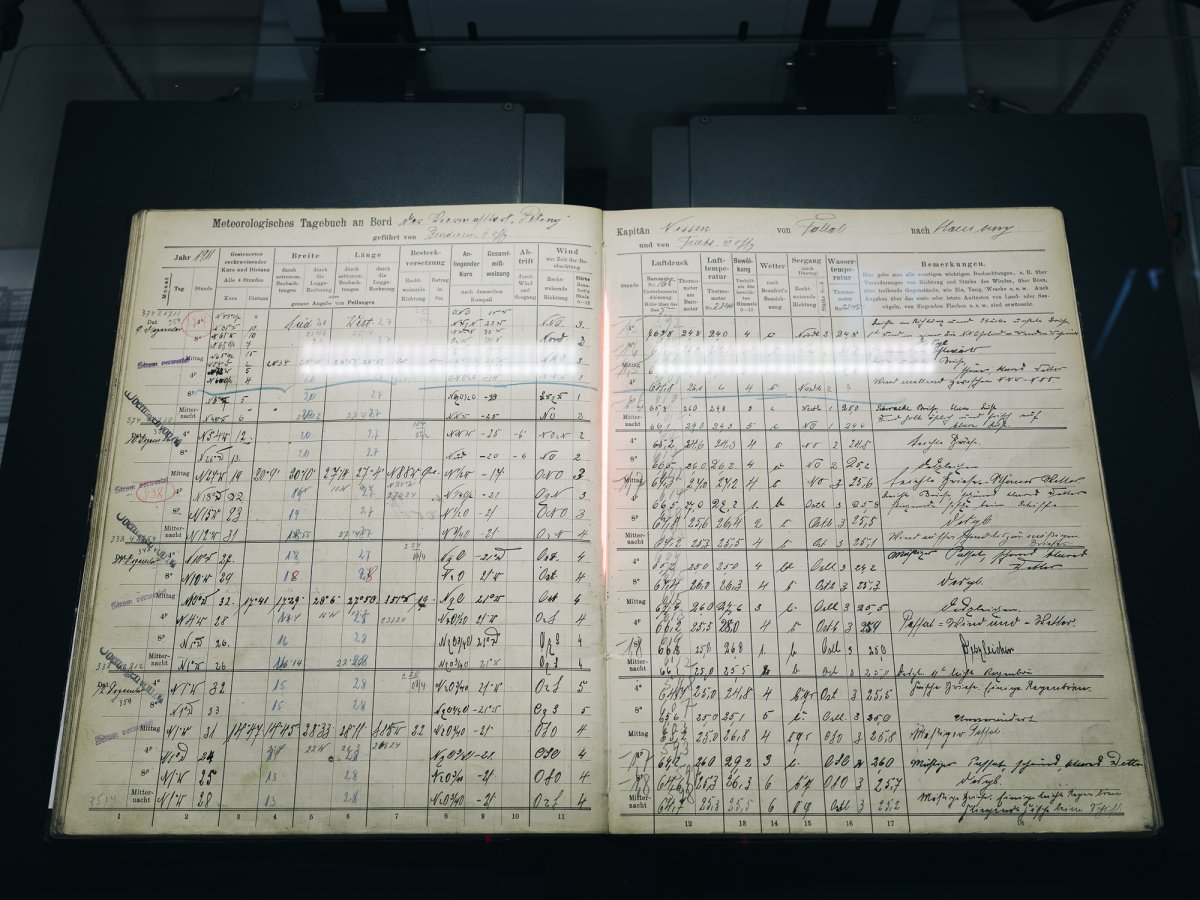
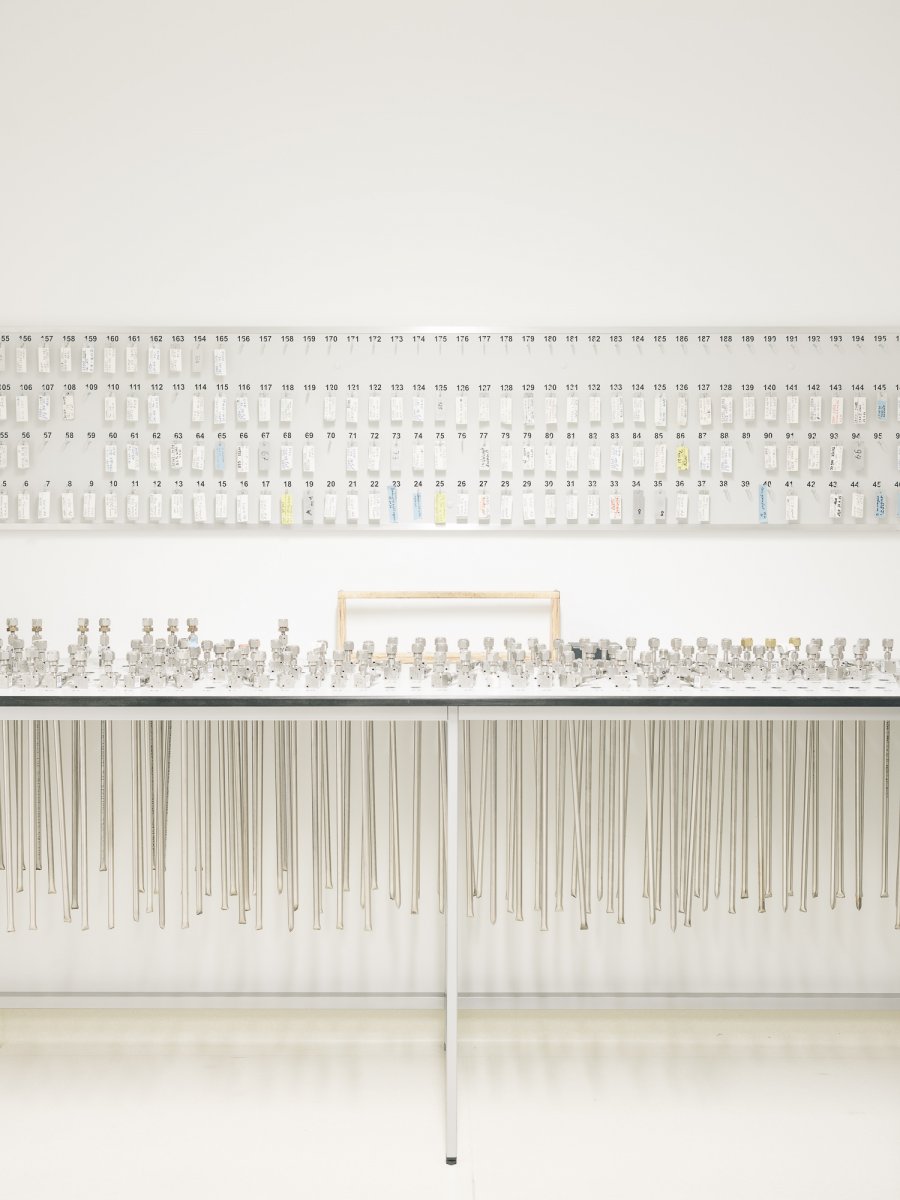
The DWD archive is located in a former deep bunker near the Hamburg jetties. The approximately 40,000 ship journals in the DWD archive have been gradually digitized for decades. Initially, the data was transferred to punched cards, but today it is scanned and read out digitally. This is mainly done by DWD employees who have been made redundant and whose weather stations have been automated. The journals made a major contribution to the understanding of wind and current dynamics in the oceans and today contribute to climate reconstruction of the 19th and 20th centuries.
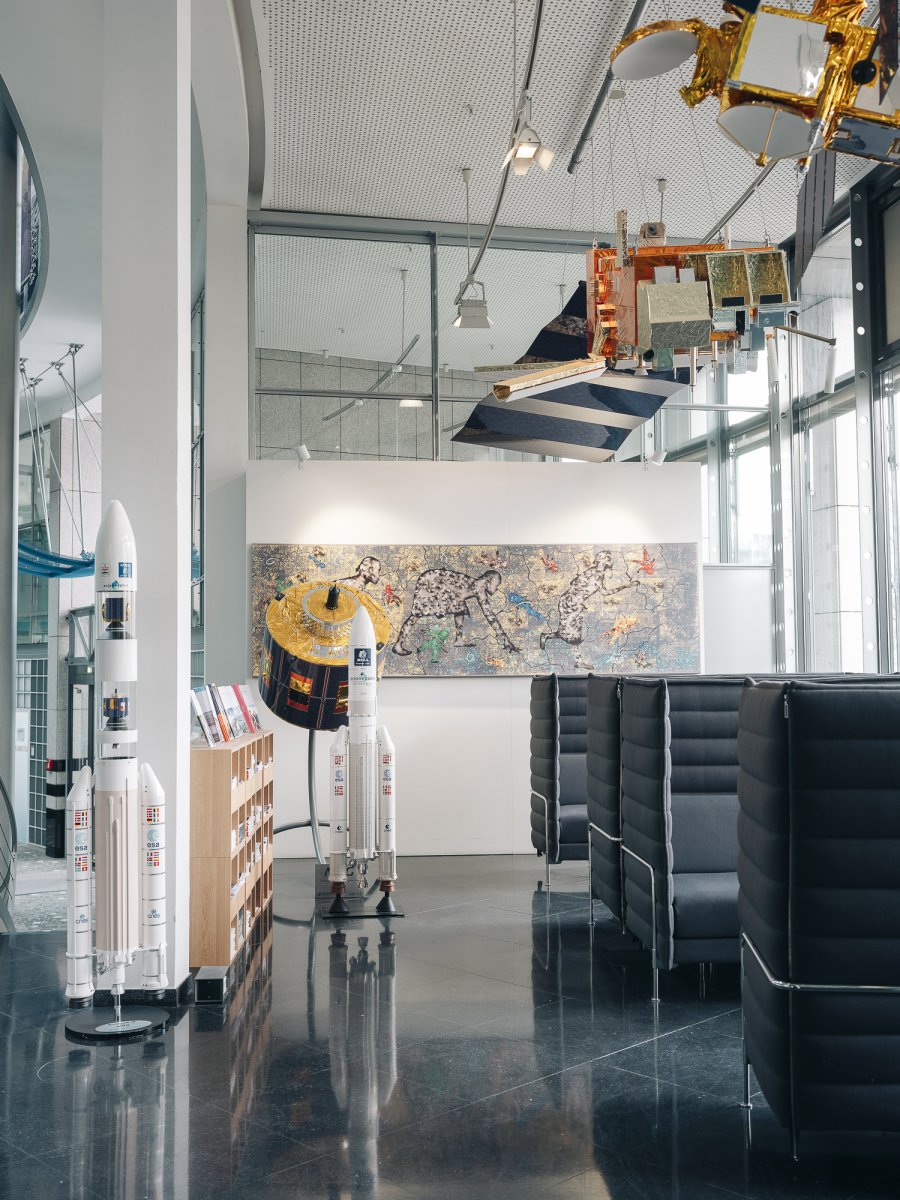
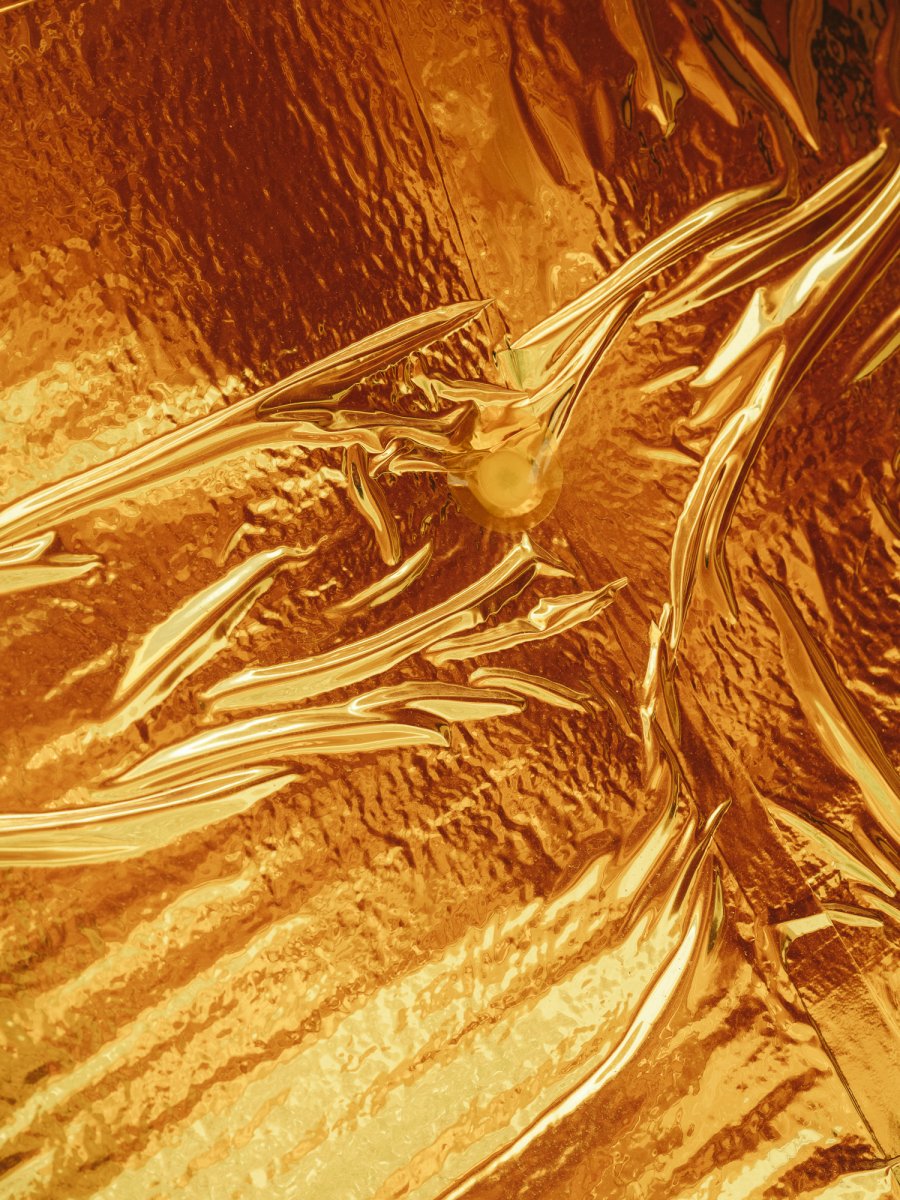
Left: Models of the weather satellites Meteosat (2nd generation, back) and Metop (2nd generation, top) and two Ariane V rockets in the entrance area of EUMETSAT in Darmstadt. Right: Gold foil on a satellite model. In use, the foil would protect the satellite from heat as it reflects incident sunlight.
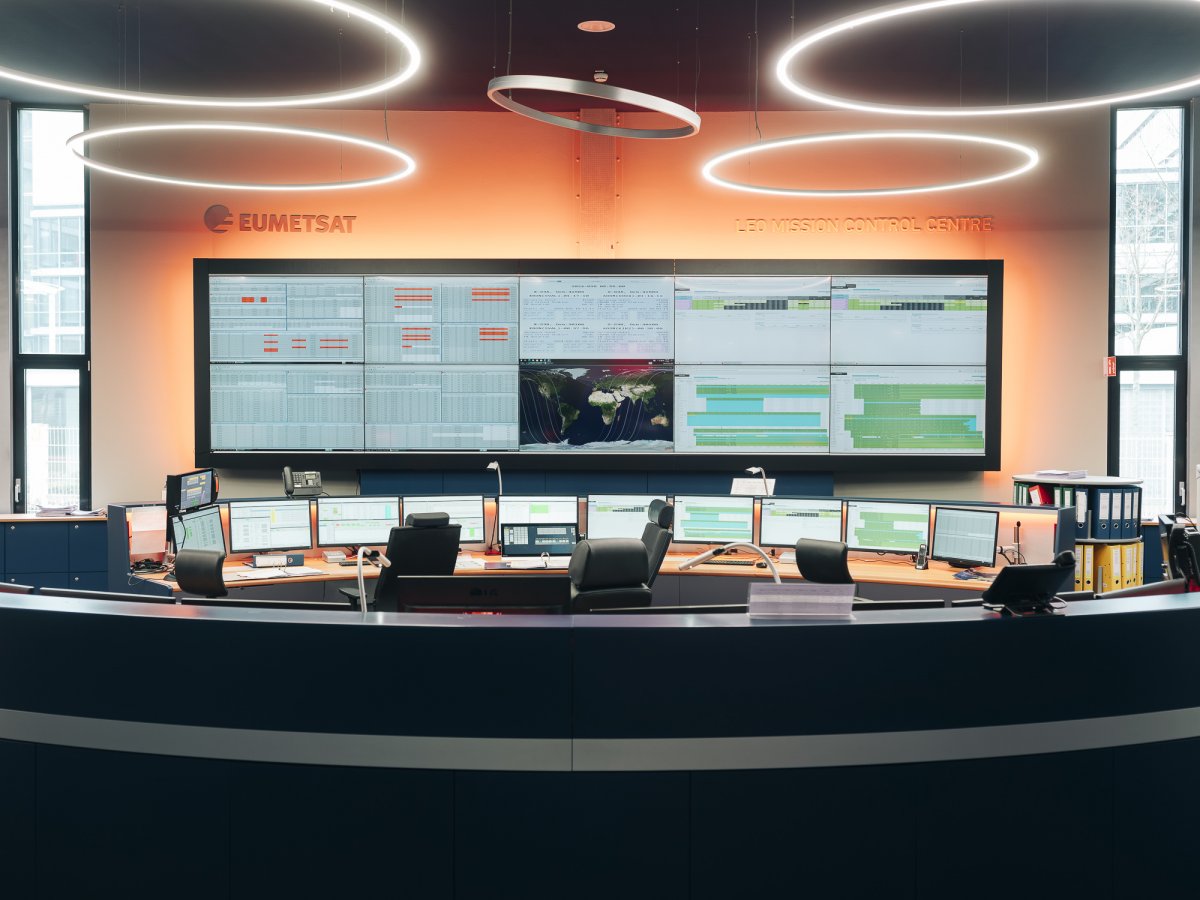
Control center of EUMETSAT in Darmstadt from where the European weather satellites are controlled and the data from the satellites are processed.
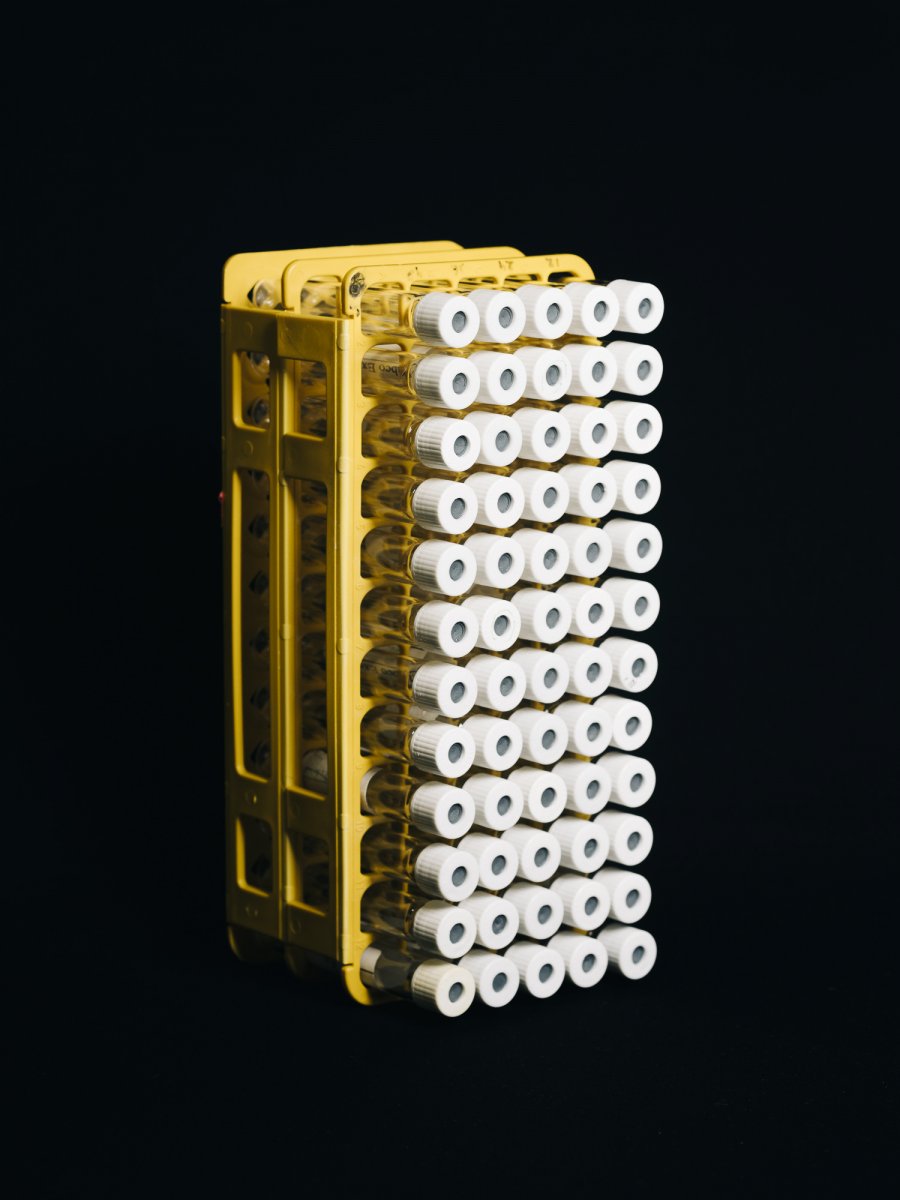
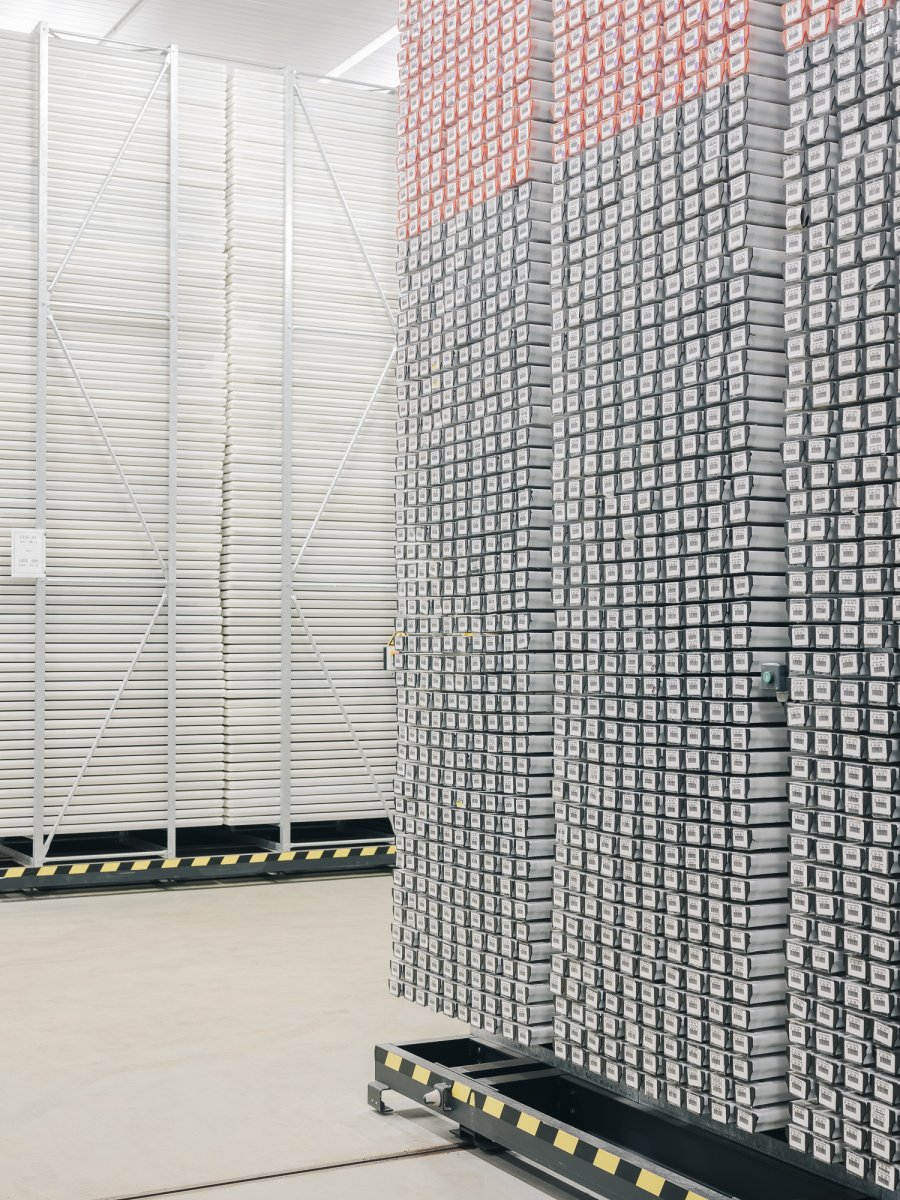
Left: Analysis container for samples drilled from dripstones Right: The core storage facility of the IODP (International Ocean Drilling Program) at the Marum in Bremen. More than 160 km of drill cores from the Atlantic, the Arctic, the Central Sea, the Black Sea and the Baltic Sea are stored here. After collection, the cores are divided into one meter long pieces and then cut in half lengthwise. Samples can be taken from one half, while the other half is archived.
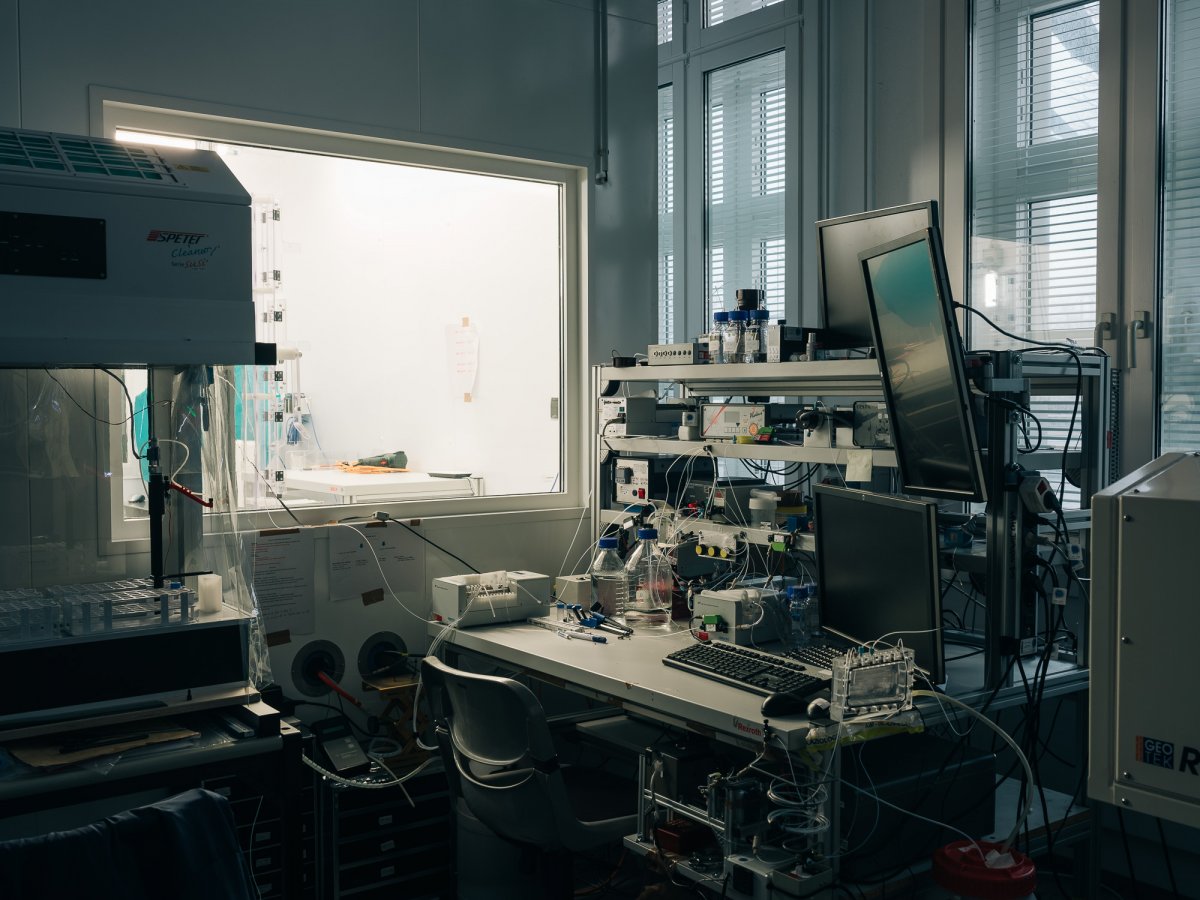
At the Alfred-Wegener-Institute in Bremerhaven research is conducted on ice cores. In the ice laboratories of the institute samples are taken from ice cores from Greenland and Antartica which are analyzed for their isotopic composition.
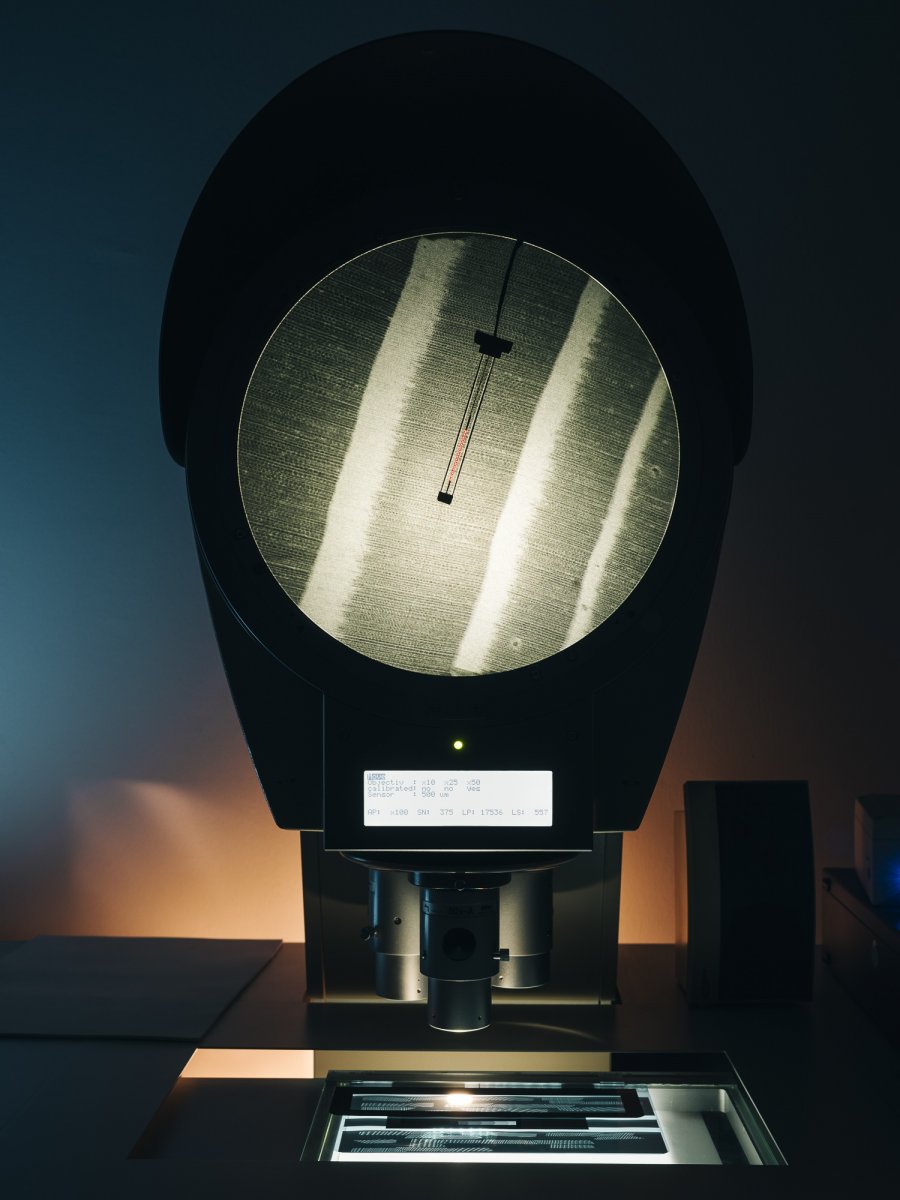
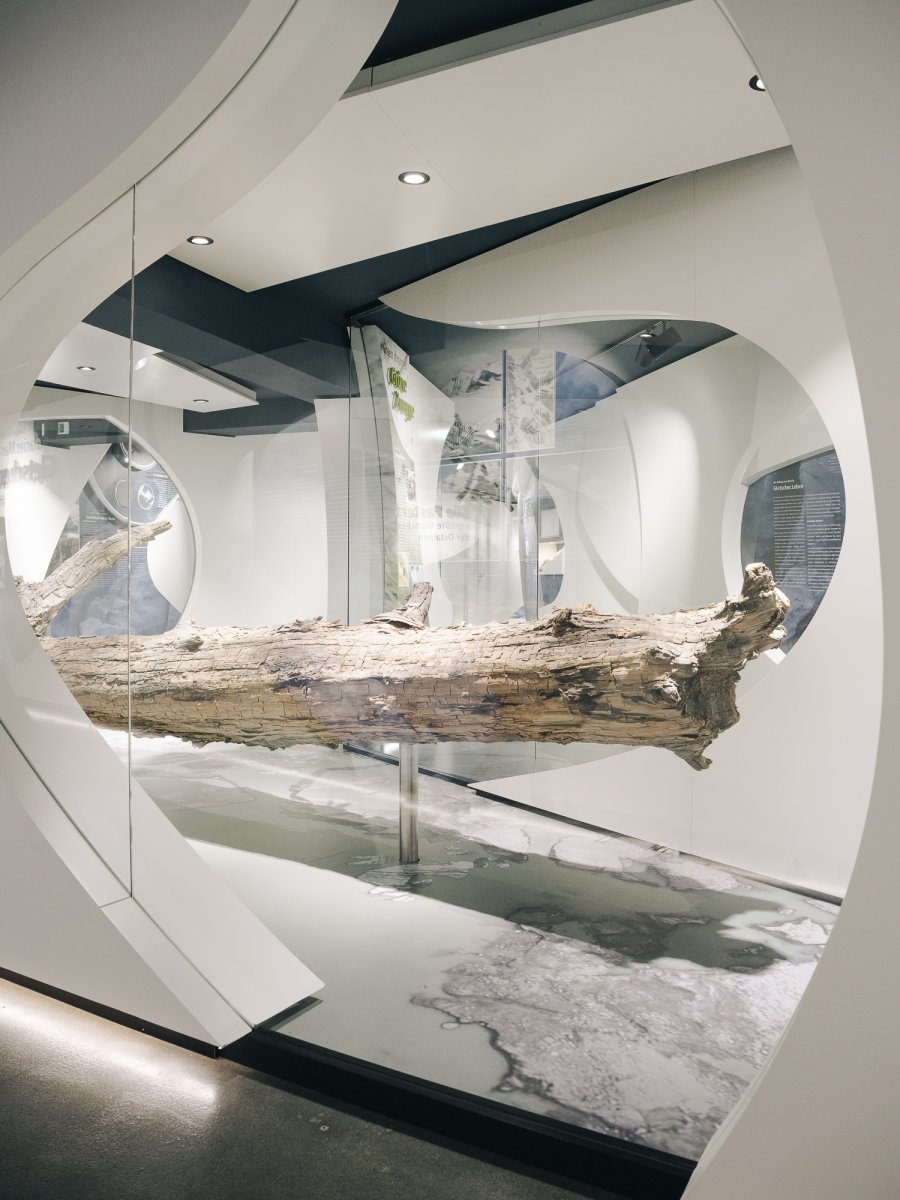
Left: At Johannes Gutenberg University in Mainz, X-ray images of pieces of wood are examined to determine the density of the wood. The width of the annual rings can provide information about the precipitation in the corresponding years. Right: Tree trunk in an exhibition at the Kaiser-Franz-Josefs-Höhe visitor center on the Grossglockner. The tree was recovered from a recently glaciated area, which proves that it was warmer in the past.
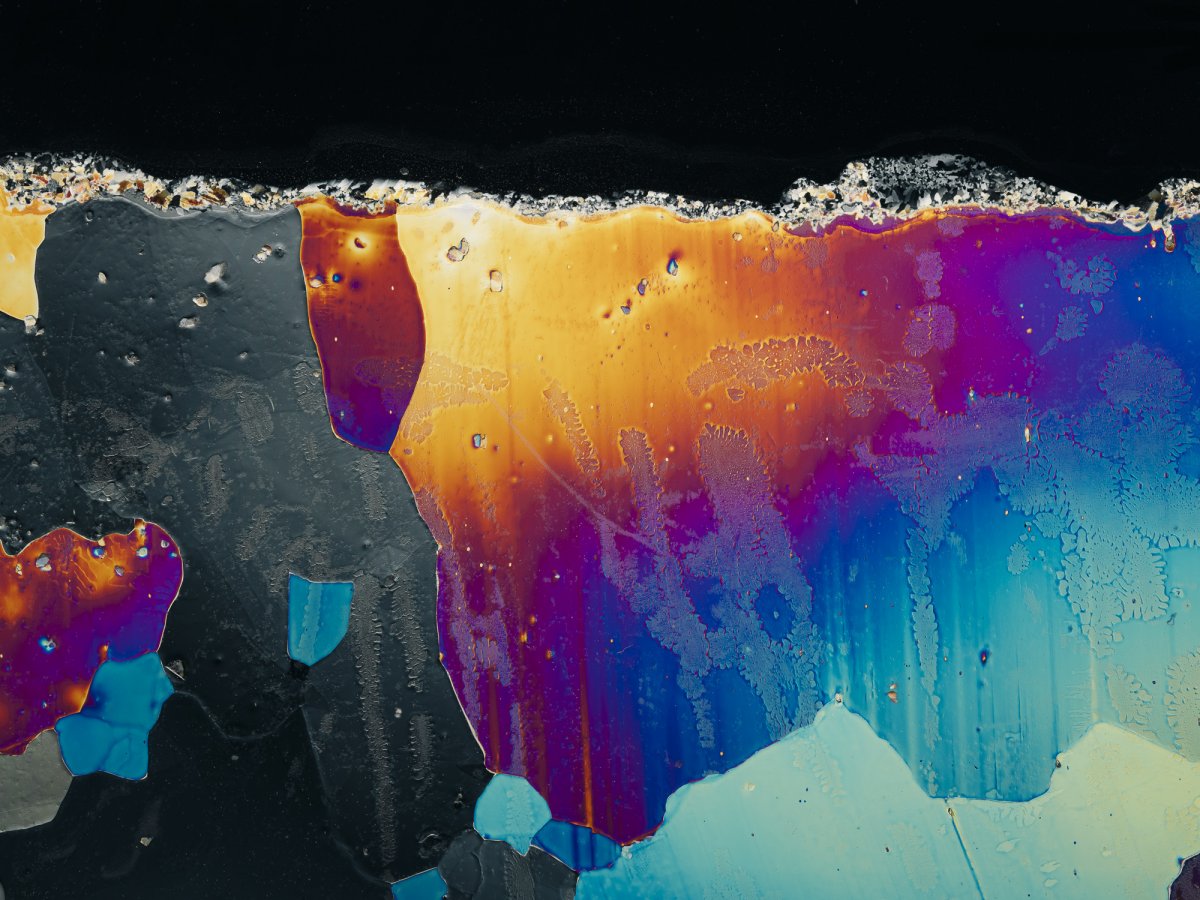
Thin section from the EDML core from the Antarctic from a depth of almost 2500 metres under polarized light. The structure of the ice crystals allows conclusions to be drawn about the dynamics of the ice sheet.
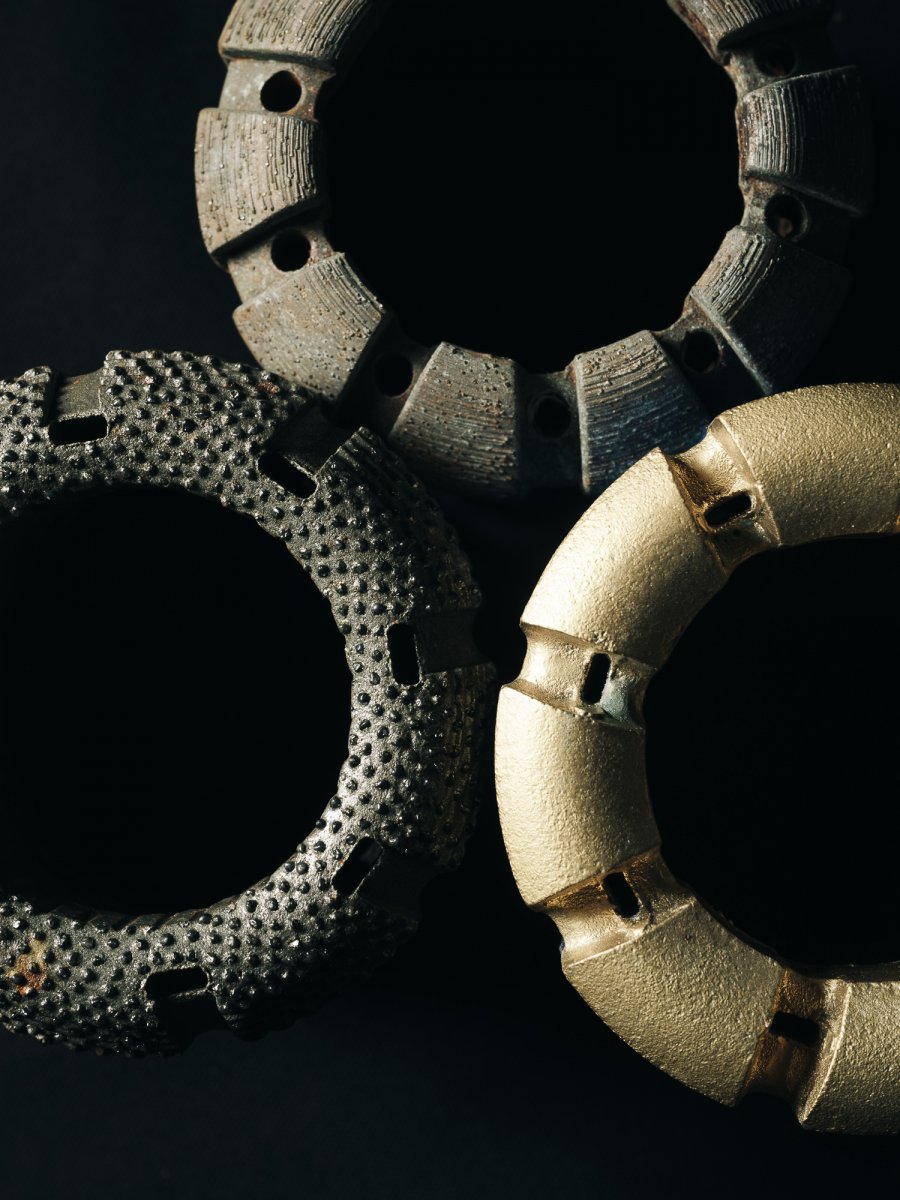
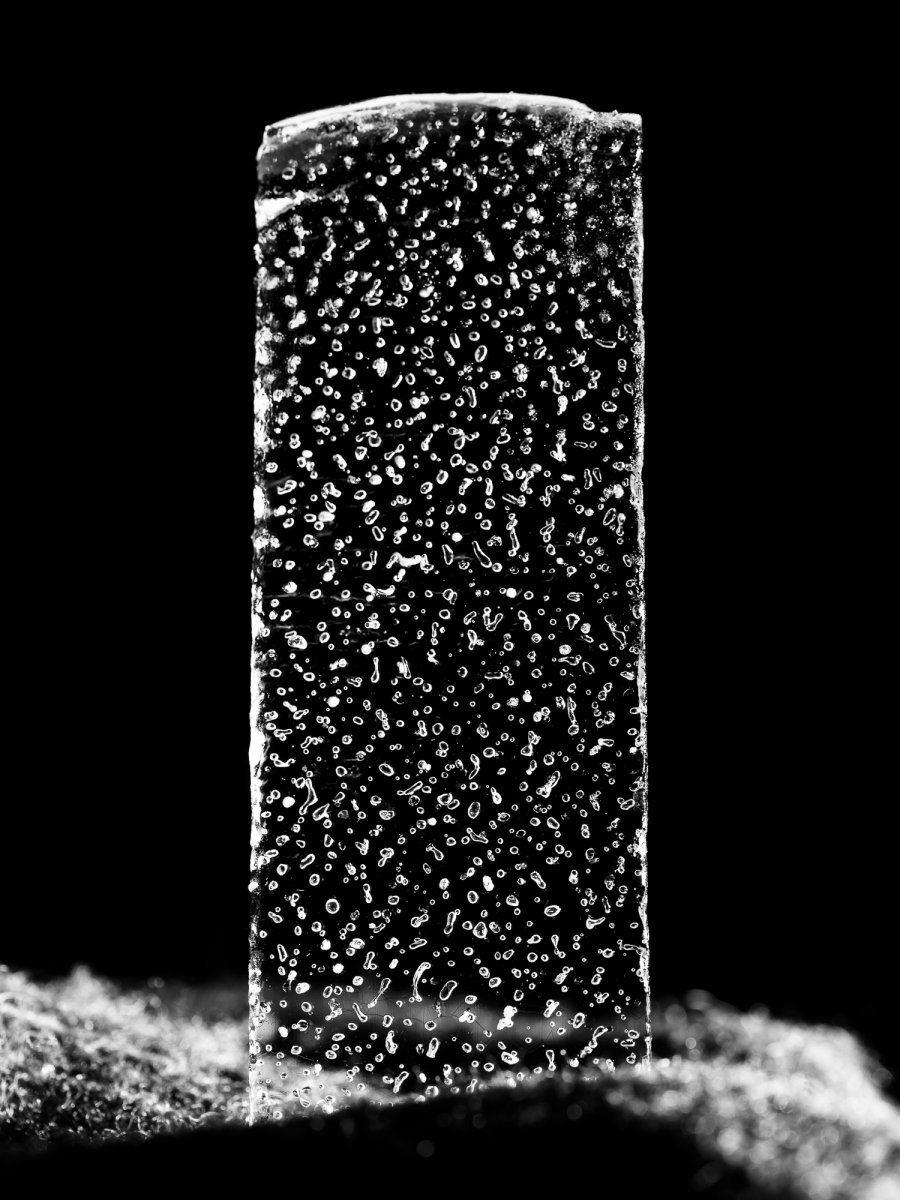
Left: Drill heads for drilling on the seabed at the Marum in Bremen. Among other things, they are used on the in-house MeBo200 seabed drilling rig Right: The air trapped in ice cores can be used to draw conclusions about the composition of the atmosphere at the time of formation.
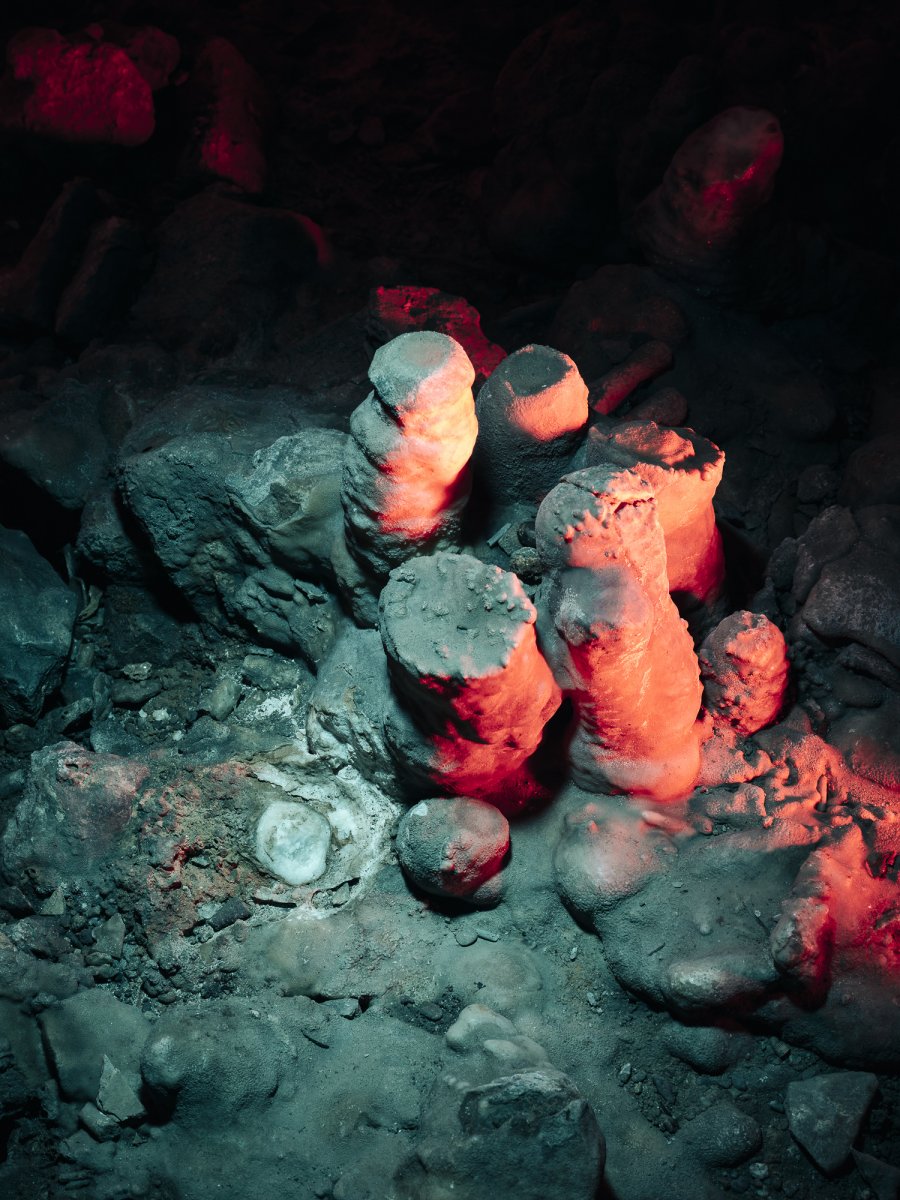
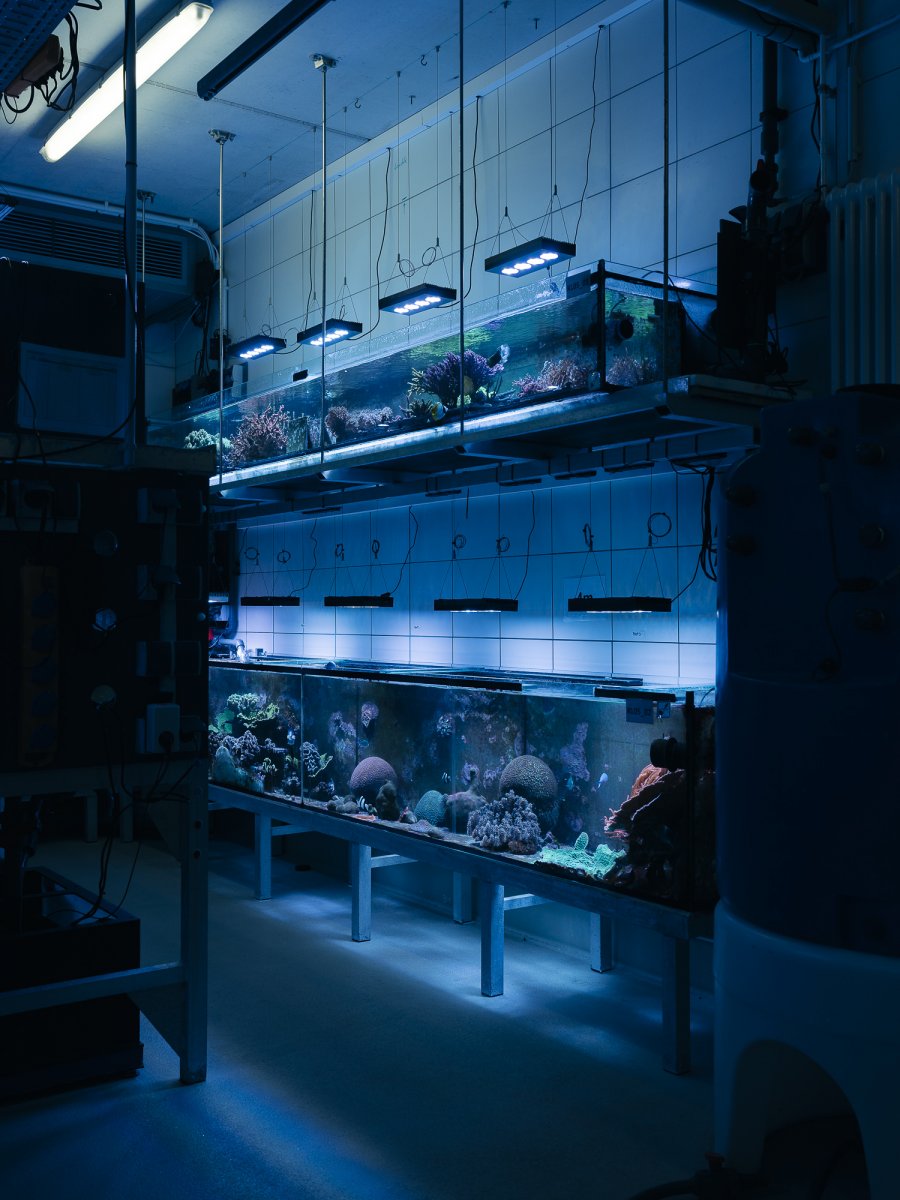
Left: Stalactites in the Dechenhöhle cave. A stalactite was removed from the bright spot, which was then examined at the Johannes Gutenberg University in Mainz. The Dechenhöhle cave has been a popular research object for geologists for decades. The local climate of the last 500,000 years has been reconstructed from the stalactites in the cave. Right: Basin with corals at the Center for Tropical Marine Research (ZMT) in Bremen. Here, scientists can adjust parameters such as salinity, water temperature and gases in the water to find out how coral growth is affected by changing climate conditions.
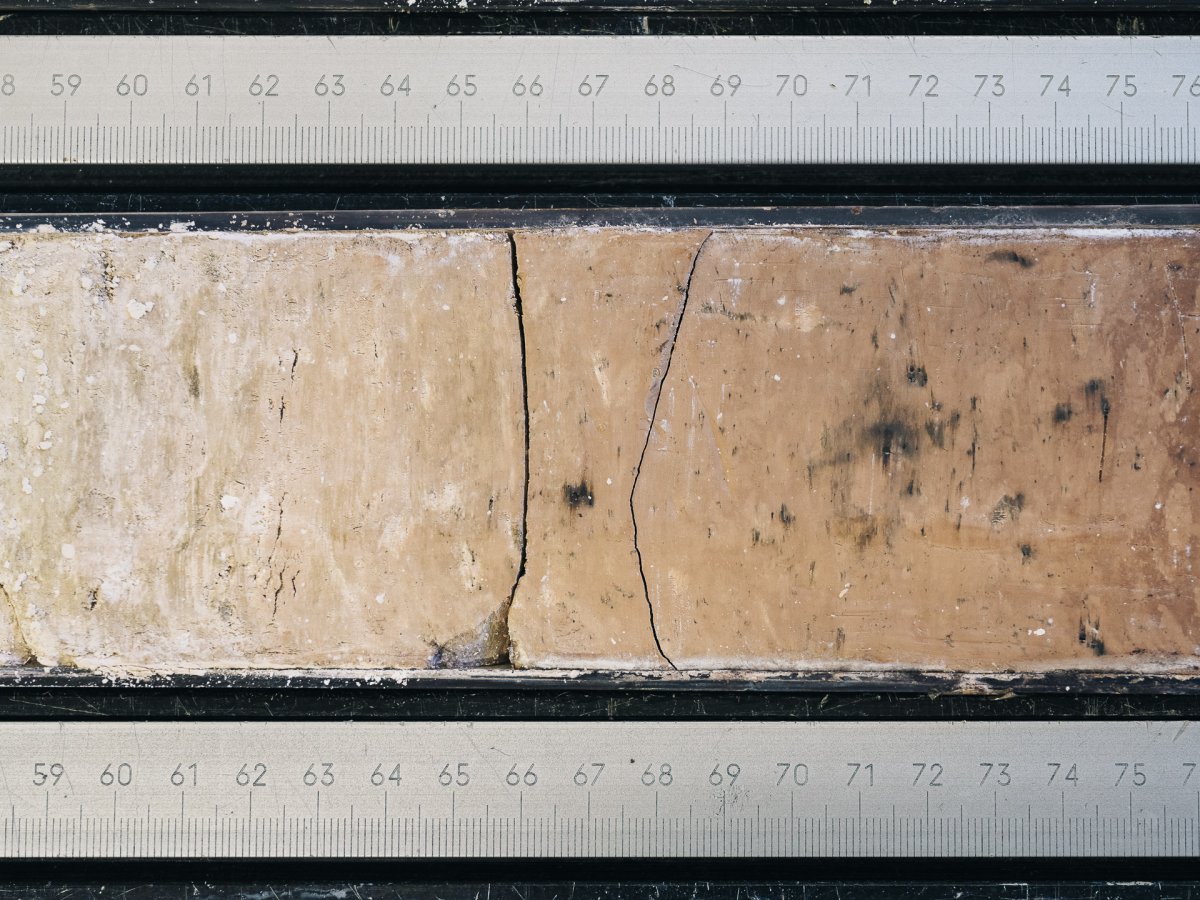
Sediment core from the IODP core repository at the MARUM in Bremen.

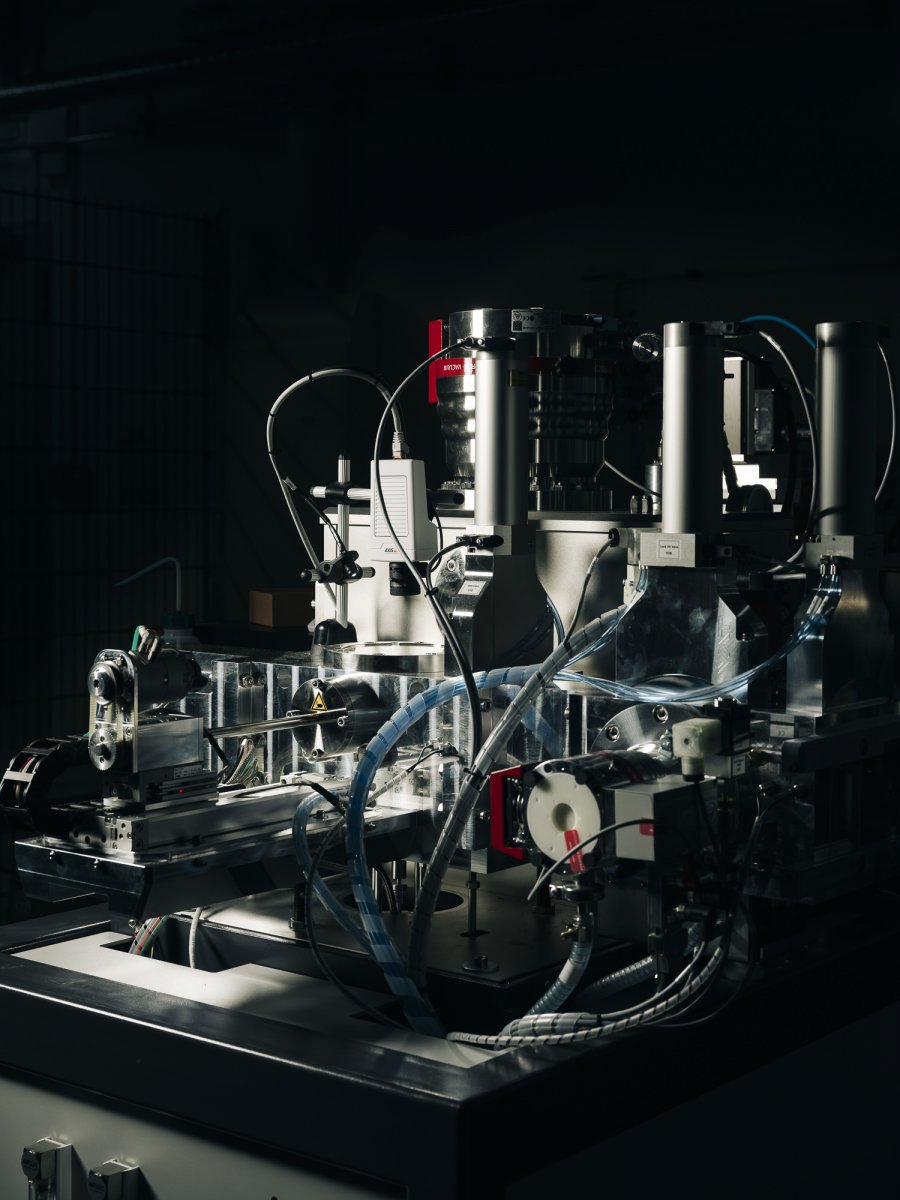
Left: Cable to a server at the Swiss Supercomputing Center (CSCS) in Lugano. Among other things, the weather forecasts for Switzerland are calculated here, which requires enormous computing power due to Switzerland's complex topography. Right: Mass spectrometer at the Curt Engelhorn Center for Archaeometry in Mannheim. Mass spectrometry is an integral part of climate reconstruction, as it enables the determination of the ratio between stable isotopes such as oxygen, which are used as approximate values for past climate zones.
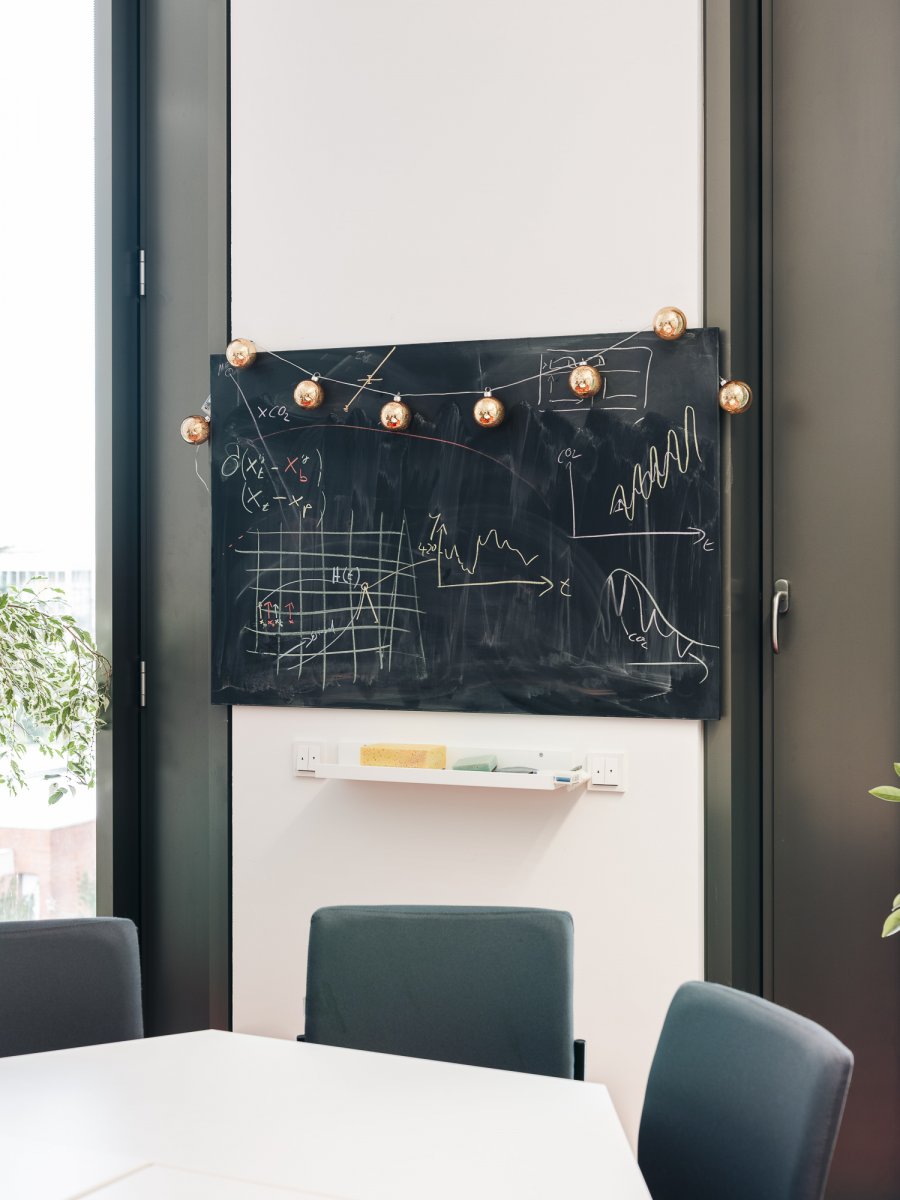
Left: Gas samples in steel pipes at the Institute of Environmental Physics in Heidelberg. As part of the ICOS project, CO2 samples from different stations around the world are analyzed to find out how much of the CO2 in the atmosphere comes from natural sources and how much is caused by human emissions. Right: Sketch of the Keeling curve on a chalkboard at the Institute of Environmental Physics (IUP) in Heidelberg.
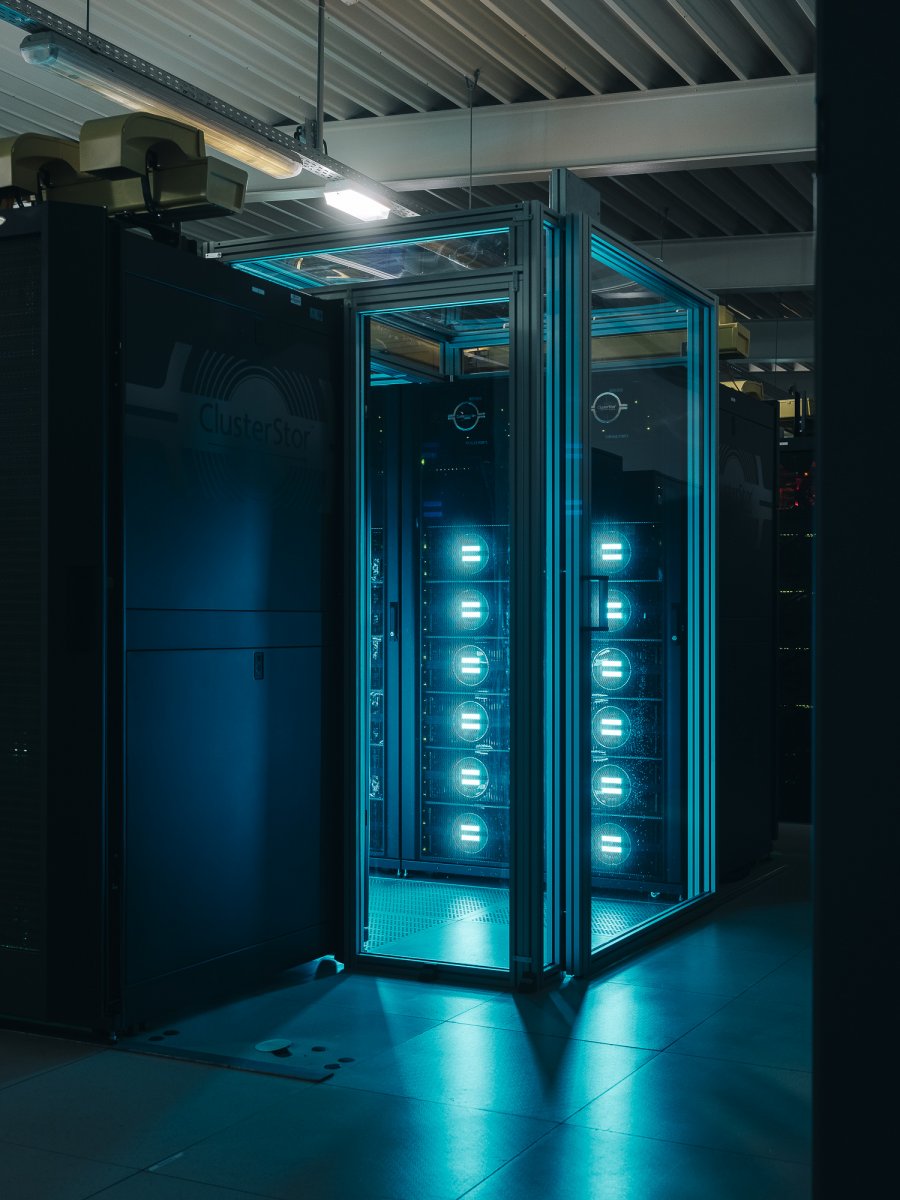
Supercomputer "Mistral" at the German Climate Computing Center (DKRZ) in Hamburg. It was able to perform 3.6x10^15 operations per second until it was shut down in 2022. The new supercomputer "Levante" can perform 14x10^15 operations per second.